Pistachio nutrition studies, calculators, and further reading:

(New!) Nitrogen and Potassium Prediction Model Calculator
Use this tool to easily calculate the Nitrogen and Potassium demand for pistachio trees.

Authors: Muhammad Ismail Siddiqui and Patrick Brown
Published in 2013.
Estimate Pistachio Tree Nitrogen Demand Calculator (Excel)
Download this Excel spreadsheet to manually calculate nitrogen demand for pistachio trees.
Pistachio Early-Season Sampling and In-Season Nitrogen Application Maximizes Productivity, Minimizes Loss
Protocol for Early-Season Sampling and In-Season Nitrogen Budgeting
Right Timing:
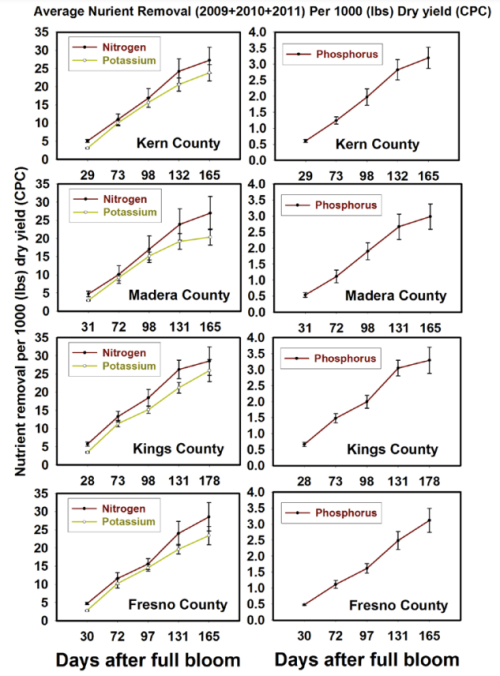
Efficient fertilization and N management require that crop nitrogen demand is satisfied, and N is applied coincident with root uptake. The dynamics of N accumulation in pistachio fruits and leaves were determined in our observational trials over three years and across four geographical locations in California from 2009–2011. The pattern and rate of N uptake from the soil can be derived from analysis of N accumulation in fruits (hulls, shells and kernels) and leaves. In pistachio, results indicate that fertilizer use can be optimized and considerable nitrogen losses can be reduced if nitrogen applications are synchronized with the actual tree demand (Fig.1).
Integrated Guidelines for Tissue Sampling, N Budget Determination and Nitrogen Fertilization Scheduling:
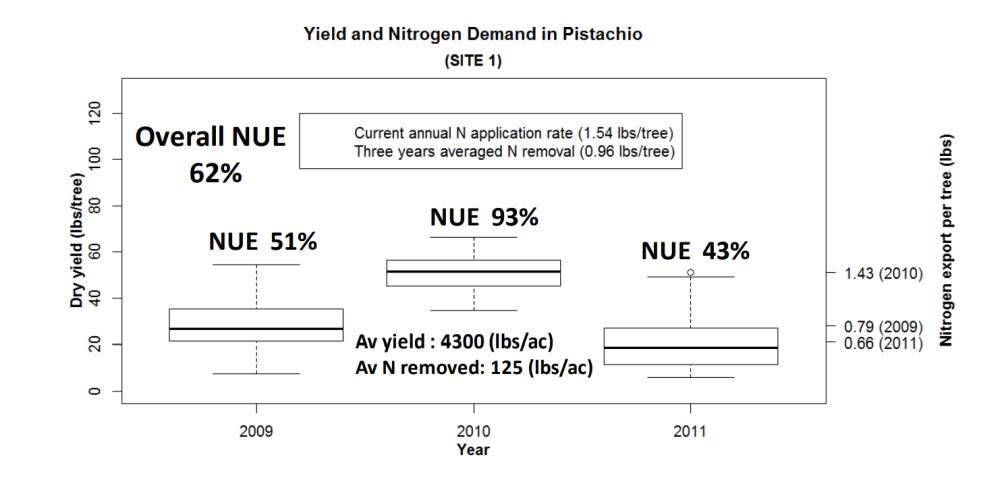
N use efficiency (% measured as N removed/N supplied x 100) is illustrated in figure 2. In this pistachio site, an annual application of 1.54 lb per tree (200 lb N per acre) was applied while the average N removal (fruit plus tree growth) over that three year period was 0.96 lb per tree (125 lbs per acre). Evidence from prior research suggests that an average of 25 (lbs) N and 22 (lbs) of K is utilized to support tree growth requirements. In the estimate of NUE we have included nutrient demand for growth. Variability in yield while fertilization was held constant did result in NUE varying from a high of 93% to a low of 43% (Fig. 2). In 2009 and 2011 NUE was less than 51% which would have resulted in substantial residual N in the soil profile at the completion of the season. The presence of residual N in the soil over winter and during preseason leaching events exposes residual N to loss below the root zone.
Preseason Predicted Crop Demand in lbs N (A): Predicted yield, as estimated in January or February (Ypred), divided by 1,000 and multiplied by 28. (Example: 4,000 lbs = 112 lbs N) Nitrogen in Irrigation Water in lbs N (B): Nitrate concentration (ppm) x acre feet irrigation applied x 0.61 or: Nitrate-N concentration (ppm) x acre feet irrigation applied x 2.7. (Example: 4 acre feet at 2.26 ppm Nitrate = 24.4 lbs N). Nitrogen from Other Inputs (Manures, Composts, Cover Crops) in lbs N (C): Should be considered as part of the nitrogen budget for pistachio. This will further reduce the amount of the nitrogen fertilizer application. Early-Spring Application Rate (D): Early-spring N application rate equals (A) minus (B+C) times 0.28 (20% of annual demand at 70% efficiency). This is the lbs. N per acre that can be applied in the spring period (Early-Spring Application). D = (112 – 24) x 0.28 = 25 lbs N. In-Season Adjustment Factor (E): Conduct leaf sampling and analysis according to methods described above for “Leaf Sampling.” The testing lab will provide a prediction of your July leaf tissue adequacy. Using your best judgment or that of an expert consultant, visually estimate the yield of the orchard in late April or May (Yest). Please note that yield estimations need only be ‘as good as possible,’ since it is recognized that this is a difficult skill and that subsequent fruit drop can occur. The intent is to be flexible in management and respond to current-season demands with adjustments in fertilization strategy.